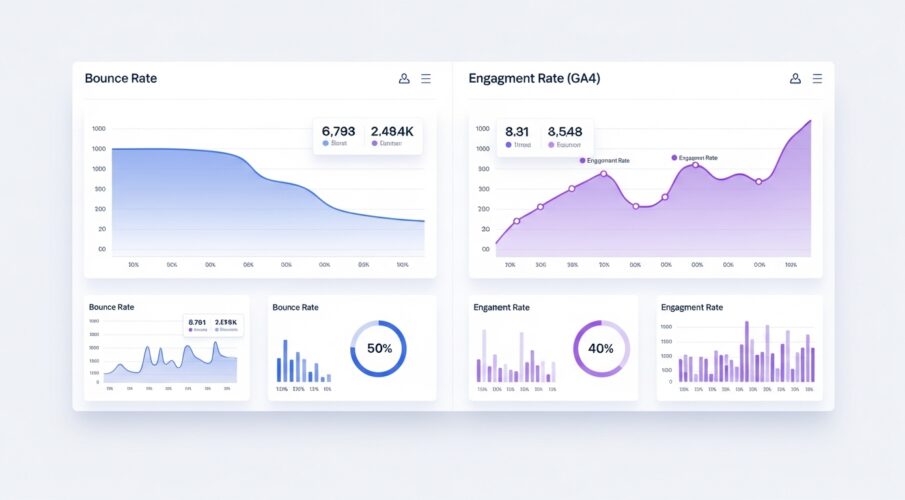
Bounce Rate vs Engagement Rate in GA4: What Really Matters
Bounce Rate vs Engagement Rate in GA4 Bounce Rate vs Engagement Rate GA4 If you migrated to Google Analytics 4 and noticed your bounce rate looked suspiciously low or disappeared entirely you weren’t imagining it. GA4 fundamentally changed how user behavior gets measured, and bounce rate was one of the biggest casualties of that shift.
The metric that marketers spent a decade obsessing over has been replaced by something GA4 calls engagement rate. They’re related, but they’re not the same thing. And if you’re still thinking about your GA4 data through a Universal Analytics lens, you’re probably misreading what’s actually happening on your site.
This guide breaks down the difference between bounce rate and engagement rate in GA4, explains why Google made the change, and gives you a clear framework for using both metrics correctly — so you stop optimizing for numbers that don’t tell the story you think they do.
What Bounce Rate Actually Measured in Universal Analytics
Before GA4, bounce rate had a specific, technical definition: the percentage of sessions in which the user triggered only a single request to the analytics server — meaning they arrived on a page and left without any further interaction being recorded.
In practice, this meant:
- A user reads a 1,500-word blog post in full, spends four minutes on your site, and leaves. Bounce.
- A user opens your homepage, finds your phone number, and calls you. Bounce.
- A user watches an embedded video on your landing page and then closes the tab. Bounce.
None of those sessions involved a low-quality user. All of them produced value. But Universal Analytics recorded them identically to the user who accidentally clicked your link from search, saw it wasn’t what they wanted, and left in two seconds.
The fundamental problem: bounce rate measured interaction with the analytics system, not meaningful engagement with your content. A session was ‘bounced’ simply because no second pageview or event was logged — regardless of whether the user got what they came for.
How GA4 Redefined the Problem with Engagement Rate
When Google built GA4, they designed the session model differently. Instead of counting a session as ‘bounced’ when no second interaction occurred, GA4 introduced the concept of an engaged session.
What Counts as an Engaged Session
In GA4, a session is classified as engaged if it meets at least one of three criteria:
- The session lasts 10 seconds or longer
- The user views two or more pages or screens
- A conversion event fires during the session
Engagement rate is simply the percentage of sessions that qualify as engaged:
Bounce rate in GA4 is the inverse — sessions that were not engaged, expressed as a percentage. It’s technically still available in GA4, but it’s calculated completely differently from the UA metric with the same name.
This is where a lot of confusion lives. Marketers assume GA4’s bounce rate is comparable to UA’s. It isn’t. A session that would have been a bounce in UA might be an engaged session in GA4 simply because the user spent more than 10 seconds on the page — even if they never scrolled, clicked, or converted.
The 10-Second Threshold — and Why It’s Configurable
The default engagement threshold is 10 seconds, which GA4 considers enough time for a user to have meaningfully seen and processed a page. This is a judgment call by Google, not a universal truth.
For content sites and long-form editorial pages, 10 seconds is arguably too low. For transactional landing pages where a quick decision is expected, 10 seconds might represent a hesitating user rather than an engaged one. GA4 does allow you to adjust this threshold in your data stream configuration — though most implementations leave it at the default.
Bounce Rate vs Engagement Rate (GA4): Side-by-Side Comparison
| Bounce Rate (Universal Analytics) | Engagement Rate (GA4) |
| Single-pageview sessions / Total sessions | Engaged sessions / Total sessions |
| A ‘bounce’ = no second hit recorded | A ‘bounce’ = session under 10s, 1 page, no conversion |
| Inversely tracks negative behavior | Directly tracks positive behavior |
| Inflated by missing events, deflated by adding any event | Based on time, pages, or conversions |
| Session duration: 0 seconds for single-page sessions | Session duration calculated even for single-page sessions |
| Limited context for content sites | More meaningful for blogs, editorial, and informational content |
| Still available in GA4 (recalculated) | Primary metric in GA4 reports |
The directional difference matters. Bounce rate tells you how many sessions went wrong. Engagement rate tells you how many sessions went right. These aren’t mathematical inverses in practice because the definitions don’t perfectly mirror each other.
Why the Switch Makes Sense — and Where It Falls Short
The Case for Engagement Rate
GA4’s engagement model is more honest for most content types. A blog post that keeps someone reading for three minutes is delivering value, even if that person never clicks to a second page. Under UA’s model, that was invisible — the session was bounced. Under GA4, it’s a clearly engaged session.
For informational sites, editorial content, single-page applications, and lead gen landing pages where users are expected to read and convert rather than browse multiple pages, engagement rate gives you a far more accurate picture of whether your content is working.
It also solves a specific UA problem: single-page sessions had a recorded duration of zero seconds, because UA calculated session duration from the gap between hits. If there was only one hit, there was no gap — so the duration was technically undefined and reported as zero. GA4 uses a different session model that calculates time even for single-page sessions, making session duration a more reliable signal.
Where Engagement Rate Has Its Own Limitations
The 10-second threshold is a blunt instrument. A user who opens your page, gets distracted, walks away for 15 seconds, and closes the tab without reading anything qualifies as an engaged session in GA4. That’s not engagement — that’s an idle tab.
Engagement rate can also be misleading for certain site types. An e-commerce site where a user lands on a product page, reads the description, and bounces because the price is too high might show a high engagement rate even though nothing commercially useful happened.
The point isn’t that engagement rate is wrong. It’s that no single metric tells the full story, and treating any one number as a proxy for site health is a trap. Engagement rate is a better default signal than UA’s bounce rate — but it still needs context.
What Engaged Sessions Tell You That Pageviews Don’t
One of the useful shifts in GA4 is that engaged sessions function as a quality filter on your traffic data. When you look at traffic acquisition reports in GA4, you can segment by engaged sessions to understand which channels are actually sending people who interact — not just people who show up and leave.
This is particularly useful for:
Comparing Paid vs Organic Traffic Quality
A channel might drive high volume with low engagement rate — a common pattern with broad display campaigns, low-quality paid search keywords, or traffic from content networks. High session count, high bounce rate equivalent, low engaged sessions. Cutting that traffic or narrowing targeting often improves both efficiency and engagement metrics simultaneously.
Evaluating Landing Page Performance
Two landing pages might receive similar traffic volumes. One has a 75% engagement rate; the other has 38%. That gap represents a real difference in how well each page matches user intent. Engagement rate here becomes a diagnostic — the question is why users disengage, not just that they do.
Identifying Content That Actually Works
In exploration reports (GA4’s more flexible analysis layer), you can combine engaged sessions with key event tracking to find which content types drive the most downstream action. A piece of content might have high engagement rate and low conversions, or moderate engagement rate and high conversion rate — each pattern suggests a different optimization priority.
Session Duration, Timeout Settings, and Why Configuration Matters
How GA4 Calculates Session Duration
GA4 calculates session duration differently than UA. In GA4, session duration is measured from the first event to the last event in a session — for every session, including single-page ones. This means if a user triggers a scroll event, a video play event, or even an engagement event (the automatic ‘user_engagement’ event GA4 fires after 10 seconds of activity), session duration reflects that.
This is a significant improvement over UA, where single-page sessions showed 0:00 duration and created a data quality problem for content sites.
Session Timeout: The Setting Nobody Checks
By default, GA4 ends a session after 30 minutes of inactivity. This is called the session timeout setting, and it lives in your data stream configuration. Most teams never touch it.
But it matters more than it looks. If your site has long-form content that users read over 35 minutes — possible for in-depth guides, tutorials, or research-heavy pieces — you could be splitting what should be a single session into two. That artificially inflates your session count and deflates your per-session conversion rate. If your audience typically makes quick decisions, the default 30 minutes is fine.
The fix is straightforward: check your average session duration and session engagement data in GA4 before assuming the default fits your use case.
Data Stream Configuration: What to Audit
Beyond session timeout, your data stream configuration controls:
- Enhanced measurement — automatically tracks scrolls, outbound clicks, site search, video engagement, and file downloads. This directly affects engagement rate because these auto-tracked events can qualify sessions as engaged.
- The engagement time threshold (default 10 seconds)
- Cross-domain tracking settings that affect how sessions are counted across subdomains
If enhanced measurement is turned off, you lose scroll and video tracking events — which means sessions where users scroll through a long post or watch a video may not qualify as engaged, even if they clearly were. Turning on enhanced measurement is almost always the right call for content-heavy sites.
Key Event Tracking: The Missing Layer in Most GA4 Setups
In UA, goals (and later, conversions) were binary: a session either converted or it didn’t. GA4 introduced key events as a more flexible alternative — any event can be marked as a key event, and the data shows up in your conversion and engagement reports accordingly.
Where this intersects with engagement rate: conversion events are one of three ways to qualify a session as engaged. If a user lands on your page, submits a form, and leaves — that’s an engaged session, even if the session lasted under 10 seconds and involved only one page. The form submission (a key event) counts.
The practical takeaway: your key event tracking setup directly shapes your engagement rate data. If you haven’t configured key events beyond GA4’s defaults, you’re probably undercounting engaged sessions — specifically, short sessions where users completed a meaningful action quickly.
What to Mark as Key Events
- Form submissions (contact forms, newsletter signups, quote requests)
- Purchases or checkout completions
- File downloads (whitepapers, pricing sheets, spec documents)
- Video completions (if video is core to your content strategy)
- Account registrations
- Outbound clicks to high-value destinations (phone numbers, booking links, partner pages
This isn’t about inflating your engagement metrics. It’s about making sure your data accurately reflects what constitutes value for your business — and that engaged sessions actually correspond to meaningful user actions, not just idle time.
Active Users vs Sessions: The Other Shift You Need to Understand
GA4 made another change that surprises analytics veterans: the default user metric is now active users, not total users. An active user is someone who had an engaged session. A total user includes everyone who triggered any event, including people who landed on your site and immediately left.
This matters because it shifts the baseline for user-based metrics. In UA, if 10,000 people visited your site in a month, your user count was 10,000 (adjusted for cookie deduplication). In GA4, your active user count might be 6,800 — the 68% of those visitors who qualified as engaged.
Neither number is more ‘correct.’ But they’re measuring different things. If you’re benchmarking against historical UA data, the active user shift alone can make GA4 numbers look lower — even if actual traffic held steady.
When building dashboards or reporting, be explicit about which user metric you’re using. Active users is GA4’s default, but total users is available and sometimes more appropriate for reach-based reporting.
Reading the Traffic Acquisition Report with Engagement in Mind
GA4’s traffic acquisition reports are where engagement rate becomes actionable. The default view shows sessions, engaged sessions, engagement rate, average engagement time, and key events by channel — giving you a richer picture of channel performance than UA’s acquisition reports ever did.
Here’s how to read it:
High Traffic, Low Engagement Rate
Typically indicates a mismatch between what the channel promises and what the landing page delivers. Common causes: broad keyword targeting, display ads with misleading creative, or landing pages with slow load times. The traffic is arriving but not connecting.
Low Traffic, High Engagement Rate
Often your best-performing channel — just low volume. Branded search traffic, referral traffic from highly relevant sources, and email campaigns frequently look like this. The engagement quality is strong; the opportunity is scale.
High Engagement Rate, Low Key Events
Users are spending time on your site but not converting. The content is engaging — but maybe there’s a missing CTA, a friction point in the conversion flow, or a mismatch between content and offer. Good engagement rate with low conversion suggests an optimization problem in the funnel, not a traffic quality problem.
Low Engagement Rate, High Key Events
Unusual but possible with transactional content — users arrive, make a quick decision, convert, and leave. The session might technically not qualify as ‘engaged’ by time or page count, but a conversion event fires. Check your key event setup if you see this pattern — it’s a sign that conversions are happening in sessions that the time-based threshold is classifying as unengaged.
Using Exploration Reports to Dig Deeper into Behavioral Flow
GA4’s exploration reports give you tools that UA’s standard interface never offered — and behavioral flow analysis is where they shine for engagement work.
Funnel Exploration
Build a funnel from landing page to key event completion. You can add engagement rate or engaged sessions as a dimension to see which steps in your funnel correlate with engaged users making it through. Users who drop off early tend to have lower engagement rates at the point of entry — this can help identify which entry pages are attracting the wrong intent.
Path Exploration
Shows what users do after a specific event or page. Particularly useful for understanding what engaged users do next — do they go deeper into your content, visit a product page, or exit? The behavioral flow of engaged sessions often looks very different from the overall average.
Segment Overlap
Create segments for engaged sessions and key event completions. The overlap shows you which engaged users also converted — and by extension, which channels, pages, and behavioral patterns predict conversion, not just engagement. This is where engagement rate analysis connects to revenue.
Frequently Asked Questions
Q1: Is GA4’s bounce rate the same as Universal Analytics’?
No. In Universal Analytics, bounce rate was single-page sessions only. In GA4, it’s the inverse of engagement rate (sessions under 10 seconds, one page, no conversion). The two are not comparable.
Q2: What is an engaged session in GA4?
A session is “engaged” if it lasts 10+ seconds, has 2+ page views, or includes a conversion event. Others are counted as bounces.
Q3: Why is my GA4 engagement rate so high?
Common reasons include auto-tracked events (like scroll), longer session timeouts, or users spending more time on content. Check your tracking setup before assuming errors.
Q4: Should I use bounce rate or engagement rate in GA4?
Use engagement rate as your main metric. It gives better insight into user activity, especially for content and lead generation sites.
Q5: How do key events affect engagement rate?
Any session with a key event (conversion) is counted as engaged, regardless of time or page views. Proper setup is important for accurate data.
Q6: Can I compare GA4 data with Universal Analytics?
No. Metrics and tracking models are different, so treat them as separate data sources.
Conclusion: Stop Chasing the Old Number
Bounce rate in Universal Analytics was a flawed metric that marketers spent years trying to game, interpret, and explain to stakeholders who misunderstood it. GA4’s engagement rate isn’t perfect either — no single metric is. But it’s a more honest signal for most of what modern content and performance marketing teams actually care about.
The shift from bounce rate to engagement rate isn’t just a naming change. It reflects a different philosophy: measuring what users do, not what they fail to do. An engaged session captures a reader, a viewer, a converter — not just the absence of a second pageview.
Where this becomes actionable: audit your key event tracking, check your enhanced measurement settings, and start reading your traffic acquisition reports through the lens of engagement rate rather than raw session counts. The combinations — channel, engagement rate, average engagement time, key events — give you a far more complete picture than bounce rate ever did.